Technical analysis is an essential tool for both new and seasoned investors, providing insights into the financial market’s movements. In this beginner’s guide, we will explore the world of Technical Analysis Chart Patterns, focusing on how to identify chart patterns, read and interpret them, and use them to make informed trading decisions.
Chart patterns are graphical representations of key price levels, support and resistance levels, and trends. Understanding chart patterns can help you identify potential trends, reversals, and support and resistance levels in the stock market, ultimately leading to more informed investment choices. Learning chart patterns is beneficial, not just for short-term trading but also for long-term investment decisions.
Unlock the Secret to Forex Success with BOB James’ Top-Performing Signals! Experience the Ease of Proven, MyFXbook-Verified Strategies and Transform Your Trading Journey Today. Don’t Miss Out on Exceptional Performance – Join Now!
Technical Analysis Chart Patterns comprise a diverse range of patterns with their unique characteristics and significance. In the following sections, we will discuss each type of pattern in detail and explore how to apply this knowledge to real-world trading scenarios.
Key Takeaways
- Technical analysis provides insights into the financial market’s movements.
- Chart patterns can help identify potential trends and support and resistance levels in the stock market.
- Technical Analysis Chart Patterns comprise a diverse range of patterns, each with its unique characteristics and significance.
- Learning chart patterns is beneficial for short-term trading and long-term investment decisions.
- In the following sections, we will discuss each type of pattern in detail and explore their real-world trading applications.
Introduction to Technical Analysis
Before delving into the world of chart patterns, it’s crucial to have a solid understanding of technical analysis. Technical analysis is a method of evaluating securities by analyzing statistics generated by market activity, such as past prices and volume. Its primary objective is to identify potential trading opportunities by examining historical market trends.
There are various concepts and principles behind technical analysis, including trend analysis, support and resistance levels, and chart patterns. By analyzing these factors, traders can make informed decisions about potential buy or sell opportunities.
“Technical analysis is a skill that improves with experience and study. Always be a student and keep learning.” – John Murphy
By utilizing technical analysis alongside fundamental analysis (the evaluation of a company’s financial health), traders and investors can gain a more complete understanding of the market and make informed investment choices.

Furthermore, technical analysis can be used in various markets beyond stocks, including forex, futures, and options. Its versatility and applicability make it a valuable tool for traders of all levels.
Candlestick Patterns: Reading the Language of Price
One of the most important tools in technical analysis is candlestick patterns. These patterns can be used to predict potential trend reversals and market movements. It’s important to understand the different types of candlestick patterns and how to interpret them.
Candlesticks are represented by a “body” and “wicks.” The body shows the opening and closing prices, and the wicks represent the highest and lowest prices of the market during the day. The color of the body can indicate either a bullish or bearish trend.
Some of the most commonly used candlestick patterns include:
Hammer and Hanging Man
The hammer pattern and the hanging man pattern are visually similar, but they have opposite implications. The hammer pattern indicates a potential trend reversal from bearish to bullish, while the hanging man pattern indicates a potential trend reversal from bullish to bearish.
Dark Cloud Cover and Piercing Line
The dark cloud cover and piercing line patterns are used to identify potential trend reversals. The dark cloud cover pattern indicates a shift from bullish to bearish, while the piercing line pattern indicates a possible shift from bearish to bullish.
Doji
The doji pattern represents indecision in the market. This can indicate a potential trend reversal or a continuation of the current trend, depending on the context in which it appears.
These are just a few examples of the many candlestick patterns available in technical analysis. By familiarizing yourself with these patterns and their significance, you can gain valuable insights into market movements and make more informed trading decisions.

“Candlestick charts offer everything bar charts do and more, incorporating the open, high, low, and close or candlestick, of a period and the relation between the open and close.” -Steve Nison
Trendlines: Identifying Market Direction
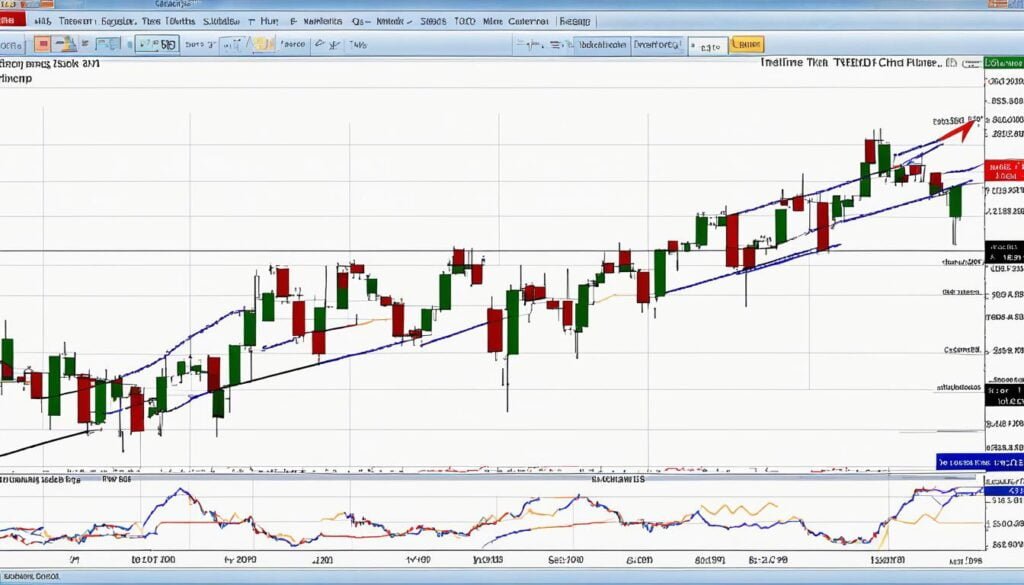
Trendlines play a vital role in technical analysis chart patterns. They allow traders and investors to identify the overall direction of the market, whether it is trending upwards, downwards, or sideways. By recognizing the trend, traders can make more informed trading decisions.
To draw a trendline, you must first identify at least two significant points, either a swing high or swing low. Once these two points have been identified, draw a straight line connecting them. The trendline should then extend forward to identify potential support or resistance levels.
It is crucial to draw trendlines correctly to avoid misleading signals. When analyzing upward trends, the trendline should be drawn below the price action, connecting two or more swing lows. Conversely, when analyzing a downward trend, the trendline should be drawn above the price action, connecting two or more swing highs.
Trendlines also play a critical role in determining support and resistance levels in chart patterns. When a price trend intersects with a trendline, it is likely to bounce off the line or move in the opposite direction. Therefore, when a stock price hits a trendline, traders can use this as an opportunity to buy or sell, depending on the direction of the trend.
“Trendlines are not only useful for determining market direction, but they also provide valuable support and resistance levels.”
Overall, understanding trendlines is essential in technical analysis chart patterns. They assist traders and investors in identifying potential trading opportunities by providing insight into the direction of the market and support and resistance levels.

Support and Resistance: Key Levels in Chart Patterns
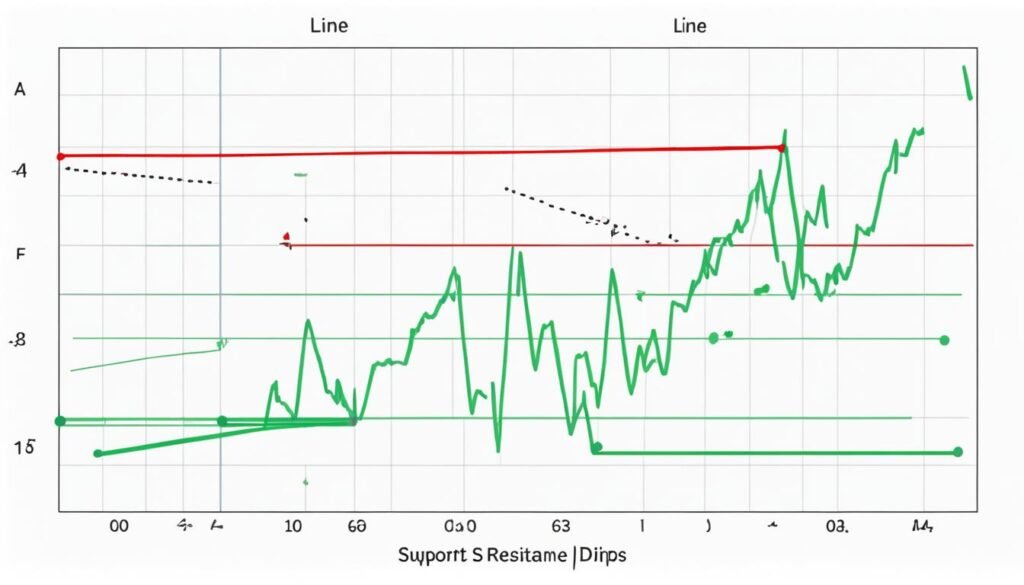
In technical analysis chart patterns, it’s essential to understand the concept of support and resistance. Support is the price level at which demand for a stock is strong enough to prevent the price from declining further. It is often depicted by a horizontal line connecting two or more lows on a chart. Resistance is the price level at which supply for a stock is strong enough to prevent the price from rising further. It is depicted by a horizontal line that connects two or more peaks on a chart.
Support and resistance levels are crucial elements in identifying potential trend reversals. When a stock price approaches a support level, it is expected to bounce back up, while approaching a resistance level signals that the stock price may decrease. As such, support and resistance levels are used to make informed trading decisions.
One way to determine support and resistance levels is to analyze past price levels and identify possible points of reversal. Another method is to use technical indicators such as moving averages or relative strength index (RSI) to identify levels of support and resistance.
By understanding and using support and resistance levels effectively, traders and investors can navigate the stock market with confidence and increase their chances of success.

Head and Shoulders Pattern: A Reliable Reversal Signal
The head and shoulders pattern is a widely recognized chart pattern that can indicate a trend reversal in technical analysis. This pattern occurs when the price of an asset forms three peaks, with the middle peak (the head) being greater than the other two (the shoulders). This creates a visual representation of a person’s head and shoulders and is hence the name of this pattern.
Traders often use the head and shoulders pattern to identify a potential price trend reversal and take appropriate positions. The pattern is considered a reliable signal, but it should always be confirmed with other technical indicators before making any trading decisions.
The head and shoulders pattern is not limited to just one timeframe and can be observed on various charts, such as hourly, daily, and weekly charts. It’s essential to be aware of this pattern’s presence as it can be found in any market, including stocks, Forex, and cryptocurrencies, and can offer trade opportunities.
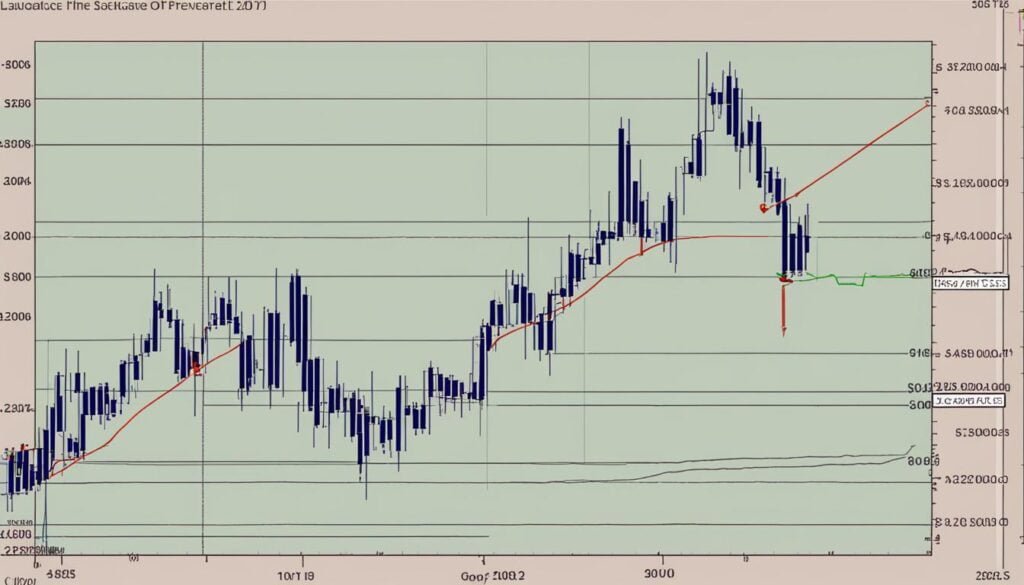
The figure above illustrates how the head and shoulders pattern looks like on a chart. In the example, the stock price is increasing, forming three peaks before reversing. Traders who knew about this pattern beforehand could have taken a short position on the asset after the trend line broke down.
The head and shoulders pattern can also have variations, such as inverted or reverse head and shoulders. Still, the underlying principle is the same – it is a visual cue for a possible change in the trend direction.
Traders should look for the head and shoulders pattern’s key characteristics, such as the symmetry between the shoulders and the length of the head. The pattern typically has a higher success rate when the head is brief and sharp and when the shoulders align closely horizontally.
Overall, the head and shoulders pattern is an essential element in technical analysis that traders should look out for. With proper understanding, traders can use this pattern to make informed trading decisions and avoid any potential losses.
Double Top and Double Bottom Patterns: Spotting Trend Reversals
In Technical Analysis Chart Patterns, double top and double bottom patterns are crucial as they are reversal patterns that signal potential trend shifts. A double top pattern occurs when the price reaches a high point twice and fails to break it both times, signaling that the price has reached its high and is likely to go down. Conversely, double bottom patterns happen when prices hit a low point twice without breaking it, indicating that the prices have reached their low and are likely to rise.
Identifying and interpreting these patterns can help investors and traders make informed decisions, avoiding potential losses or missing out on profitable opportunities.
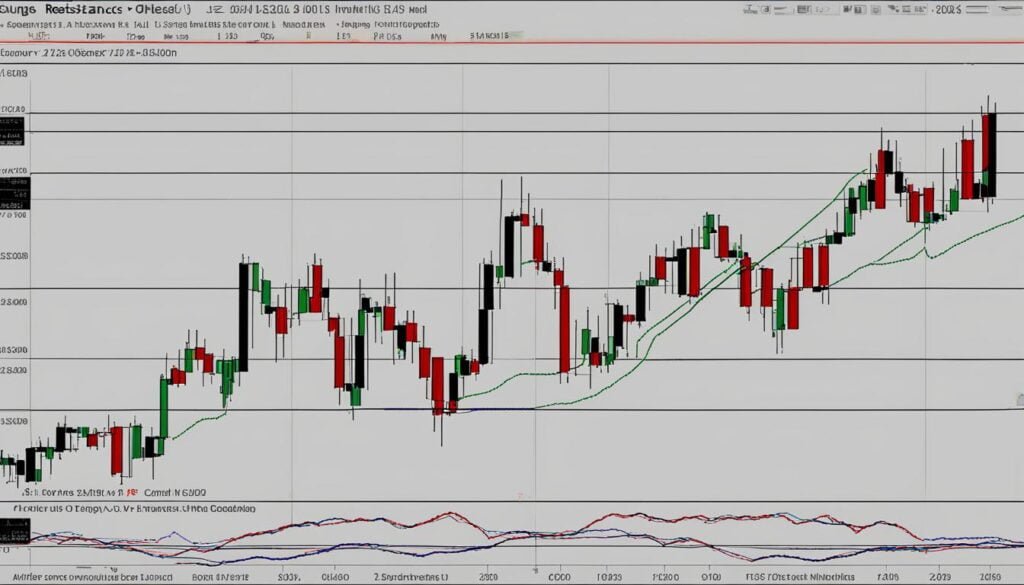
As shown in the chart, the price reached a high point twice, indicated by two black circles, but failed to make a breakthrough, forming a double top pattern. Knowing this can help traders sell at the peak and avoid potential losses.
As shown in the chart, the price hit a low point twice, indicated by two black circles, without breaking it, forming a double bottom pattern. Investors who recognize this pattern can buy at the low point and capitalize on a potential price rise.
Ascending Triangle, Descending Triangle, and Symmetrical Triangle Patterns
Triangle patterns are continuation patterns in technical analysis chart patterns that indicate a potential breakout or breakdown. These types of patterns occur when there is a convergence of a trend line and horizontal line. Three types of triangle patterns are used for trading decisions:
- Ascending triangles: an upward trend with a flat upper line and an upward sloping lower line.
- Descending triangles: a downward trend with a flat lower line and a downward sloping upper line.
- Symmetrical triangles: no clear trend with both a sloping upper and lower bound.
Traders use these patterns to identify potential trade setups in the market by looking for price breakouts above or below the trend lines. For instance, when the market price moves above or below a trend line, a breakout or breakdown will occur, signaling an entry point for traders to either buy or sell.
How to Identify Triangle Patterns
To identify these patterns, traders look for the convergence of the trend line and the horizontal line. The trend line connects the higher lows in the ascending triangle and the lower highs in the descending triangle, while the horizontal line connects the highs of a symmetrical triangle or the lows of an inverted symmetrical triangle.
Traders can use various technical analysis tools to identify these patterns, such as line charts and candlestick charts. They also pay attention to the trading volume, which should be low during the pattern formation and high during the breakout.
Implications for Trading Decisions
The implication of these patterns is a potential continuation of an existing trend. In an ascending triangle pattern, the price is likely to continue to increase after the breakout. In a descending triangle pattern, the price is likely to decrease after the breakdown. In a symmetrical triangle pattern, the price can go up or down depending on whether a breakout or breakdown occurs.
Traders can use a stop-loss order to mitigate risks since these patterns can sometimes result in false breakouts. A stop-loss order is a type of order that limits the trader’s loss in case the price moves in the opposite direction.
Putting It All Together: Practical Application of Chart Patterns
Learning about chart patterns is not enough; their actual implementation is crucial in trading success. In this section, we will present real-life examples and case studies to demonstrate how chart patterns can be applied to actual trading scenarios.
For instance, let’s consider the head and shoulders pattern that we discussed earlier. Suppose a beginner trader notices this pattern on a stock they are interested in. To make an informed decision, they need to analyze the volume and price at each shoulder. By looking at these factors, the trader can predict the potential price movement and place their trades accordingly.
Similarly, in the case of double top or bottom patterns, knowing how to analyze the price patterns and volumes can help traders understand when to enter or exit a trade.
To further understand the practical implementation of chart patterns, let’s take a look at the following table:
| Chart Pattern | Implications |
|---|---|
| Head and Shoulders Pattern | Indication of a potential trend reversal |
| Double Top Pattern | Indication of a potential trend reversal |
| Symmetrical Triangle Pattern | Indication of a potential continuation pattern |
| Descending Triangle Pattern | Indication of a potential downtrend continuation |
| Ascending Triangle Pattern | Indication of a potential uptrend continuation |
By analyzing the above table, traders can interpret the implications of different chart patterns and use that knowledge to make informed trading decisions.
Overall, grasping the practical implementation of chart patterns is essential for traders to identify potential trends and reversals and make informed decisions.
Conclusion
In conclusion, technical analysis chart patterns can be a powerful tool for traders and investors looking to gain a competitive edge in the market. By learning to interpret chart patterns such as candlestick patterns, trendlines, support and resistance levels, and various triangle patterns, investors can make more informed trading decisions.
While chart patterns offer valuable insights into market movements, it’s important to remember that they are just one tool in a trader’s toolkit. Technical analysis should always be used in combination with fundamental analysis and risk management strategies to create a comprehensive trading plan.
Whether you’re a beginner or an experienced trader, developing a solid understanding of technical analysis chart patterns can help you identify potential opportunities for profit while managing risk. So, start exploring the world of technical analysis chart patterns today and see how it can enhance your trading skills.
FAQ
What is technical analysis?
Technical analysis is a method of analyzing financial markets by studying historical price and volume data to identify patterns, trends, and support and resistance levels. It helps traders and investors make informed decisions based on past market behavior.
Why is technical analysis important?
Technical analysis is important because it provides valuable insights into market trends and potential price movements. By analyzing chart patterns, traders can identify entry and exit points, predict market reversals, and manage risk more effectively.
What are chart patterns?
Chart patterns are specific formations that occur on price charts, indicating potential market behavior. They can provide information about trend continuation, trend reversal, and potential breakout or breakdown levels. Common chart patterns include head and shoulders, double top, double bottom, ascending triangle, descending triangle, and symmetrical triangle.
How do I identify chart patterns?
Chart patterns are identified by analyzing price action and the formation of specific shapes or patterns on a price chart. Traders look for specific criteria and characteristics that match the pattern they are trying to identify. This involves identifying trendlines, support and resistance levels, and specific price movements.
What is the significance of trendlines in technical analysis?
Trendlines are key tools in technical analysis as they help identify the overall direction of a market trend. They are drawn by connecting consecutive lows or highs on a price chart. Upward-sloping trendlines indicate an uptrend, while downward-sloping trendlines indicate a downtrend.
How do support and resistance levels affect chart patterns?
Support and resistance levels are horizontal lines or zones on a price chart where the price tends to react or reverse. These levels play a crucial role in chart pattern analysis as they can validate or invalidate a pattern. Support levels are where buying pressure is expected to increase, while resistance levels are where selling pressure is expected to increase.
What is the head and shoulders pattern?
The head and shoulders pattern is a reversal pattern that consists of three distinct peaks, with the middle peak (the head) being higher than the two surrounding peaks (the shoulders). It indicates a potential trend reversal from bullish to bearish and is seen as a reliable signal by technical analysts.
What are double top and double bottom patterns?
Double top and double bottom patterns are reversal patterns that occur when the price reaches a resistance level twice or a support level twice, respectively, but fails to break through. These patterns indicate a potential trend reversal and can be valuable for traders looking to capitalize on market reversals.
What are ascending, descending, and symmetrical triangles?
Ascending, descending, and symmetrical triangles are triangle chart patterns that indicate potential trend continuation or reversal. Ascending triangles have a flat upper trendline and a rising lower trendline, descending triangles have a flat lower trendline and a declining upper trendline, while symmetrical triangles have converging trendlines. Breakouts from these patterns can provide valuable trading opportunities.
How can I apply chart patterns in real trading scenarios?
To apply chart patterns in real trading scenarios, it is essential to combine them with other technical indicators and tools. Traders should look for confirmation signals, such as trendline breaks, candlestick patterns, or volume indicators, to validate the pattern and execute trades with higher probability of success.


